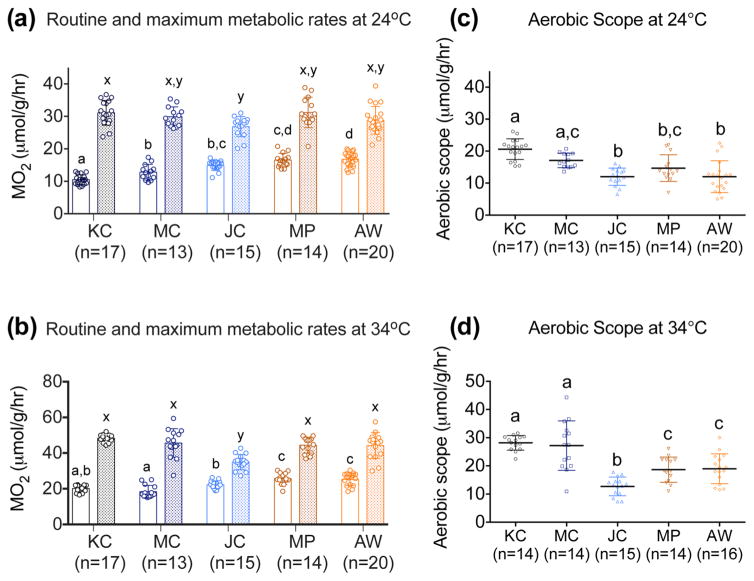
Figure 4.
Routine metabolic rates (RMO2; μmol g−1 hr−1) (clear bars), maximum metabolic rates (MMO2; μmol g−1 hr−1) (filled bars), and aerobic scope (MMO2 – RMO2; μmol g−1 hr−1) for Kings Creek (KC), Mains Creek (MC), Jones Creek (JC), Money Point (MP) and Atlantic Wood (AW) fish at 24 °C (a and c) and 34 °C (b and d). Data are presented as mean ± SD. Different letters above the bars (a, b, c, and d for RMO2 and aerobic scope; x and y for MMO2) denote statistically significant differences across populations for a given measurement (One-way ANOVA followed by Tukey’s test; P < 0.05).

