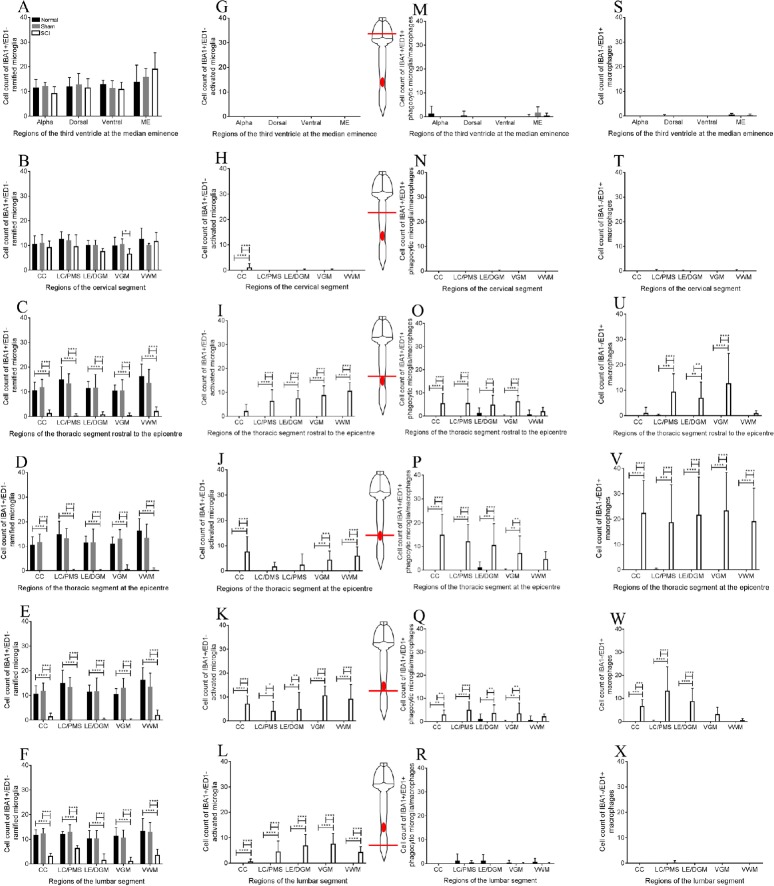
Figure 7.
Cell counts of IBA1+/ED1– ramified microglia, IBA1+/ED1– activated/phagocytic microglia, IBA1+/ED1+ phagocytic microglia/macrophages and IBA1–/ED1+ macrophages.
(A, B) IBA1+/ED1– ramified microglia cell counts at the third ventricle and the cervical enlargement. (C–F) Significant difference was found in IBA1+/ED1– ramified microglia cell counts at all regions of the injured spinal segments compared to the normal and sham surgery groups. (G) No IBA1+/ED1– activated microglia were found at the third ventricle of the neuroaxis. (H–L) Significant difference in IBA1+/ED1– activated microglia was found throughout the injured spinal segments in the SCI group compared to the normal and sham surgery groups. (M, N, R) No significant difference in IBA1+/ED1+ phagocytic microglia/macrophages was found at the third ventricle, cervical enlargement and lumbar enlargement. (O–Q) IBA1+/ED1+ phagocytic microglia/macrophages cell counts were significantly increased at the lesion site in the SCI group compared to the normal and sham surgery groups. (S, T, X) No significant difference in IBA1–/ED1+ macrophage cell counts was found at the third ventricle, cervical enlargement and lumbar enlargement. (U–W) Cell counts of IBA1–/ED1+ macrophages were significantly higher at the lesion site in the SCI group compared to the normal and sham surgery groups. For the normal and sham-operated spinal cords, the posterior median septum (PMS) and dorsal grey matter (DGM) were used to compare IBA1 and ED1 staining intensity in the SCI group at the lesion center (LC) and lesion edge (LE) respectively. Bonferroni post-hoc test was used to determine significant differences in IBA1 and ED1 cell counts. Error bars represent standard deviation (*P < 0.05, **P < 0.01, ***P < 0.001, ****P < 0.0001).

