Fig. 2.

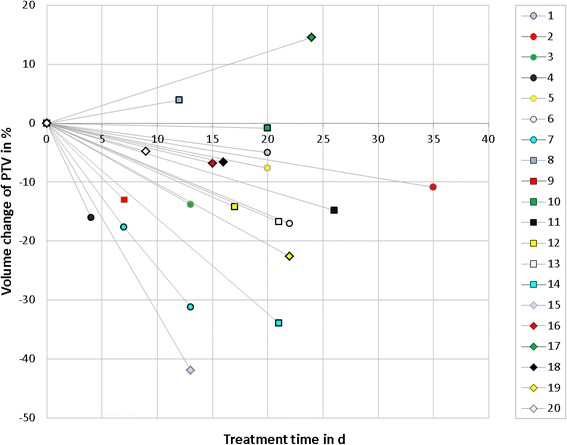
Volume change of PTV as a function of treatment time for 20 patients. The treatment time shows the day within the course at which a request for plan adaptation was scheduled

Volume change of PTV as a function of treatment time for 20 patients. The treatment time shows the day within the course at which a request for plan adaptation was scheduled