
Fig. 3.
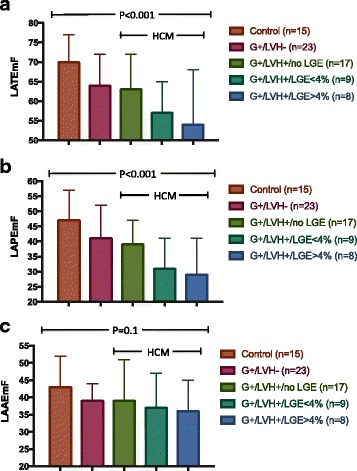
Bar graphs depicting the measured (a) Total (LATEmF) and (b) Passive (LAPEmF) and (c) Active (LAAEmF) Emptying Function in Normal Controls (G-LVH-), subjects with sarcomere mutations without LVH (preclinical, G + LVH-), and sarcomere mutation HCM subjects with overt LVH (G + LVH+) further stratified by having no LGE, ≤4% LGE and >4% LGE by CMR assessment. Adjusted for age, sex and BSA