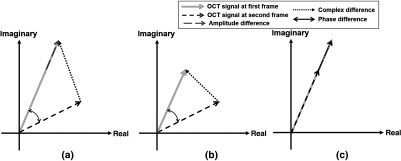
Fig. 2.
Schematic comparison of the phase, amplitude, and complex signal-based approaches. The diagram presents OCT signals captured at the same location within the same a time interval, illustrating different scenarios when a moving particle interacts with the OCT beam for comparing the phase, amplitude, and complex signal-based approaches: (a) typical cases when particle interacts the OCT beam, (b) a special case when the particle moves parallel to the OCT beam, and (c) a special case when the particle moves perpendicular to the OCT beam.

