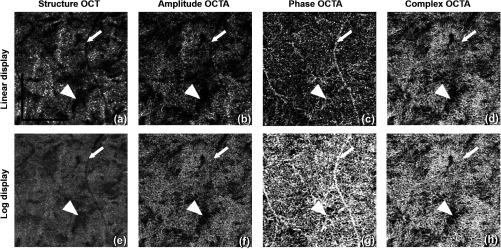
Fig. 5.
Comparison of CC OCTA with AM + GM approach using (a–d) linear and (e–h) log display. From left to right column are the results for OCT structure, amplitude OCTA, phase OCTA, and complex OCTA, respectively. Arrowheads indicate a region of low structural signal. Arrows indicate the tailing artifact from a retinal vessel. .

