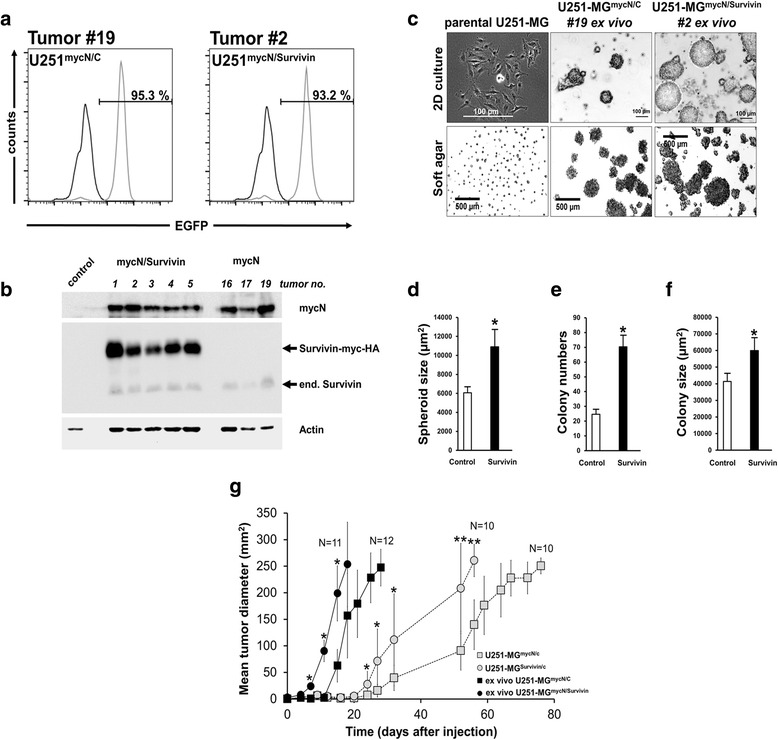
Fig. 7.

Increased tumorigenicity of mycN-induced U251-MG xenografts. a Flow cytometry analysis showing purity of sorted EGFP-positive U251-MG cells (grey line) from tumors #2 and #19. U251-MG wildtype cells were used as negative control (black line). b Western blot analysis confirmed expression of transgenic Survivin (24 kDa), endogenous Survivin (16.5 kDa) and mycN (67 kDa) in mycN/Survivin containing tumors #1, #2, #3#, #4, #5 and mycN-containing tumors #16, #17, #19. As additional control non-cancerous mouse tissue (control) was prepared and included in the analysis. Membranes were re-probed with α-actin (42 kDa) to confirm equal loading. c U251-MG xenograft-derived cells tranduced with mycN and Survivin and mycN alone form spheres when using standard cell culture conditions. Depicted are the mean values ± SEM. *p < 0.05. d Note that U251mycN/Survivin cells formed significantly larger spheres when comparted to U251mycN/C cells. e, f U251-MGmycN/Survivin cells form more and larger colonies in soft agar than U251-MGmycN/C cells. Depicted are the mean values ± SEM. *p < 0.05 g Tumor growth curve re-transplantated U251-MGmycN/Survivin cells and U251-MGmycN/C cells Tumor growth rates are faster when compared to tumors produced by freshly transduced U251-MGmycN/Survivin and U251-MGmycN/C cells. Depicted are the mean values ± SEM. *p < 0.05; **p < 0.01
