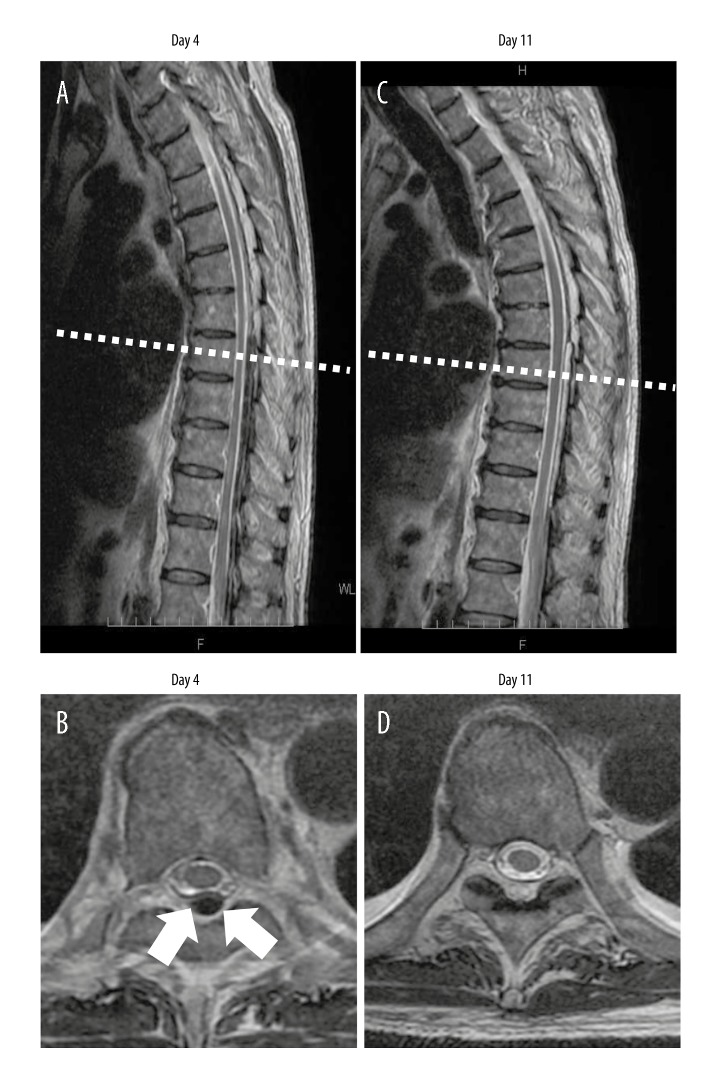
Figure 2.
Follow-up magnetic resonance imaging (MRI) of the thoracic spine on day 4 and day 11. (A, B) MRI images on day 4. (C, D) MRI images on day 11. (A, C). The size of the epidural hematoma has decreased over time. (B, D) In transverse magnetic resonance images of the spine captured at the level of the dotted lines in images A and C respectively, there is a reduction in the size of the hematoma (arrows).

