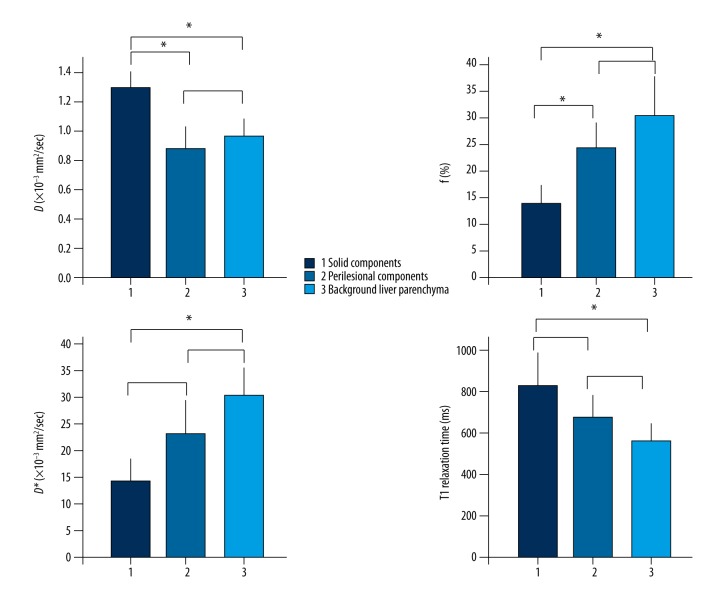
Figure 1.
Comparison of parameters, diffusion coefficient (D), perfusion fraction (f), pseudo-diffusion coefficient (D*), and T1 relaxation times in different components of hepatic alveolar echinococcosis (HAE). The data in Table 1 were analyzed by ANOVA method to calculate p values for a single parameter between solid components, perilesional components, and background liver parenchyma (see Table 1), and then by the post-test of ANOVA for p value between pairs; * p<0.05.

