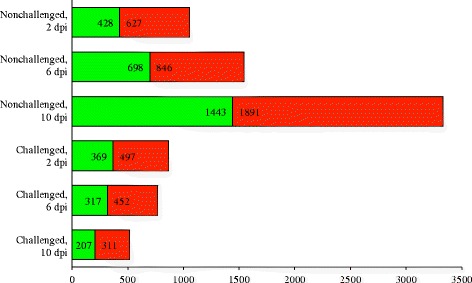
Fig. 3.

Differentially expressed genes between the Fayoumi and Leghorn at each time within each challenge state. The number of differentially expressed genes (FDR < 0.05) between the Fayoumi and Leghorns are shown for the nonchallenged and challenged birds at each time point. Genes in green were more highly expressed in the Leghorns. Genes in red were more highly expressed in the Fayoumis. The number of genes more highly expressed in each line is labeled within the green and red bar, for each contrast
