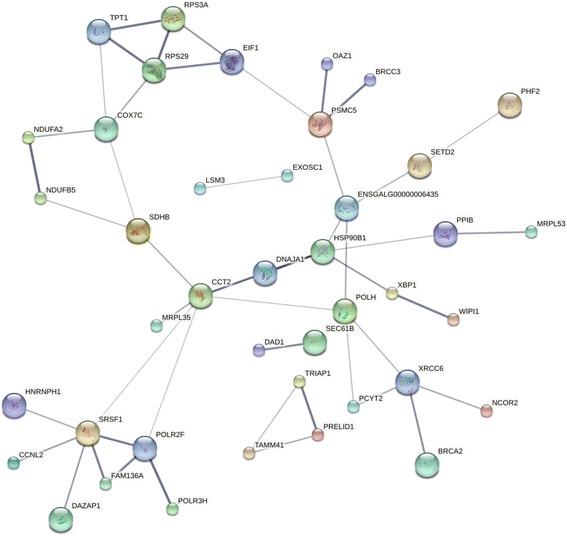
Fig. 4.

STRING network for genes impacted by the interaction between challenge and line at 10 dpi. Differentially expressed genes (FDR < 0.05) from the challenge*line interaction at 10 dpi were input into STRING for network analysis. Disconnected nodes were removed and a medium confidence score (0.400) was utilized. All edges represent protein-protein interactions; the thicker the edge the more evidence to support that connection. Proteins of unknown structure (small nodes) and predicted structure (large nodes) are represented in various colors
