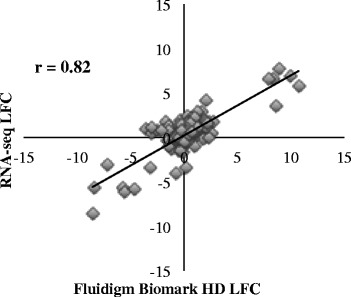
Fig. 8.

Validation of RNA-seq technology using the Fluidigm HD Biomark system. This plot is composed of 210 points comparing the log2 fold change (LFC) as estimated by Fluidigm Biomark HD (x-axis) and RNA-seq (y-axis) for the Fayoumi vs. Leghorn contrasts within each time (2, 6, 10 dpi) and each treatment group (challenged, nonchallenged), resulting in six total contrasts for 35 genes
