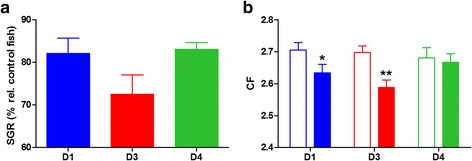
Fig. 9.

Effect of butyrate on growth parameters upon Enteromyxum leei infection in T3. a Specific growth rate (SGR) of challenged (R) fish represented as mean percentage (+ SEM) relative to each control group for the different dietary groups. b Condition factor (CF) represented as mean + SEM of each control (open bars) and recipient (solid bars) group for each dietary group. Asterisks represent significant differences between each pair of control and recipient groups (*P < 0.05, **P < 0.01)
