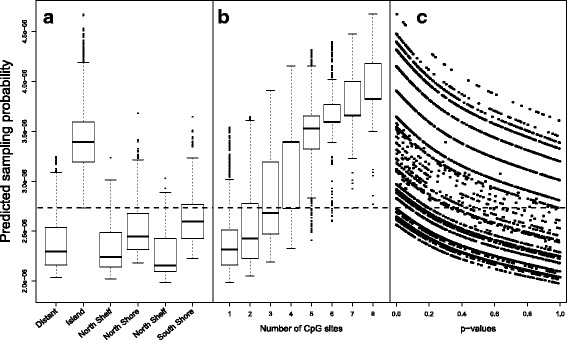
Fig. 5.

Fit of the co-data model for the cervical cancer example. Displayed are the estimated sampling probabilities for 10000 randomly selected methylation sites displayed by (a) location of the methylation site, (b) the number of CpGs, and (c) p-values. Figure c only displays the methylation sites that are up-regulated
