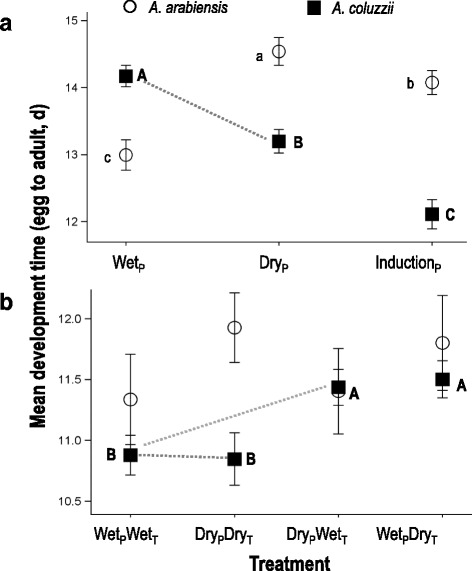
Fig. 1.

Mean developmental time for female A. arabiensis (white circles) and A. coluzzii (black squares) under (a) three photoperiod treatments (Experiment 1): wet season, dry season, and wet to dry transition (induction), and (b) four photoperiod-temperature treatment combinations (Experiment 2). The subscript ‘P’ and ‘T’, denote photoperiod and temperature conditions, respectively. Mean ± 2SE are given and significantly different values within each species are designated with letters (REGWQ groupings). The grey dotted line denotes the critical comparison between wet-season and dry-season A. coluzzii in each experiment
