
Fig. 4.
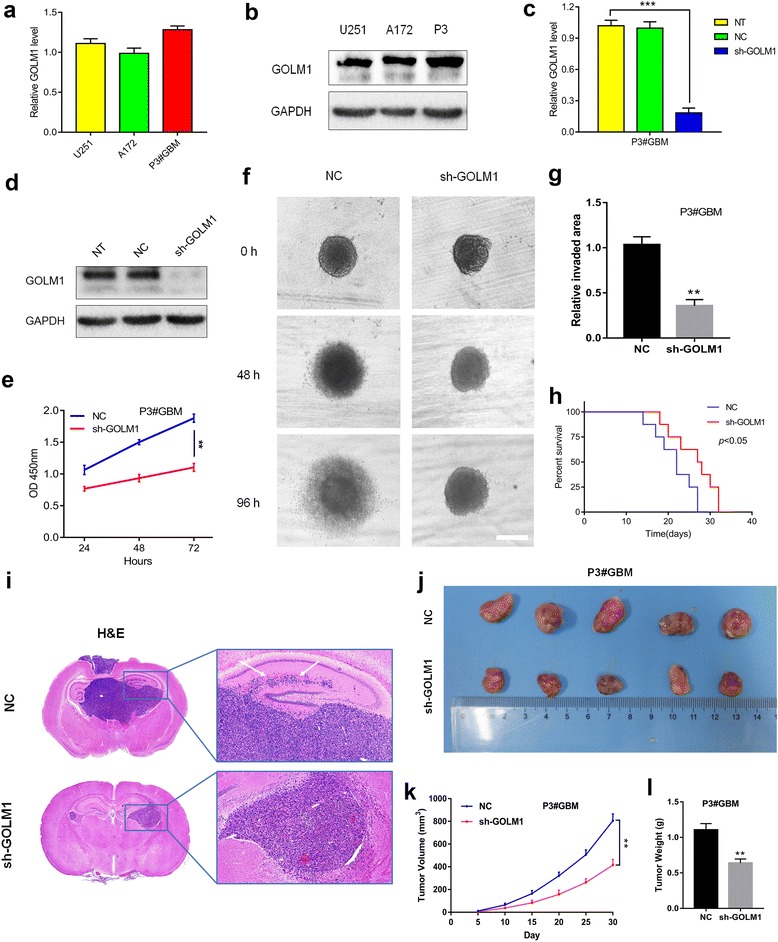
GOLM1 knockdown inhibits glioma progression in P3#GBM cells in vitro and in vivo. Expression of GOLM1 in U251, A172 and P3#GBM cells was analyzed by a qRT-PCR and b western blot. Overexpression of GOLM1 in P3#GBM cells was confirmed by c qRT-PCR and d western blot analysis. e CCK8 assay for cell viability. f Representative images of invaded spheroids in 3D invasion assay for P3#GBM-NC and -sh-GOLM1 cells. Scale bar = 200 μm. g The area covered by invading cells was quantitated after 96 h of incubation. h Kaplan-Meier survival analysis of mice implanted with P3#GBM -NC (n = 8) and -sh-GOLM1 (n = 8) cells. The log-rank test was used to calculate P-values, which were <0.05. i Representative H&E images of intracranial tumors derived from P3#GBM -NC and -sh-GOLM1 cells. White arrows in zoomed image highlight tumor cells that have invaded to adjacent brain tissues. j Representative images of subcutaneous P3#GBM -NC and -sh-GOLM1 xenografts after surgical removal are also shown. k Tumor growth curves in nude mice from the P3#GBM -NC and -sh-GOLM1 groups. l Tumor weight from the P3#GBM -NC and -sh-GOLM1 groups. (**P < 0.01, ***P < 0.001)