
Fig. 5.
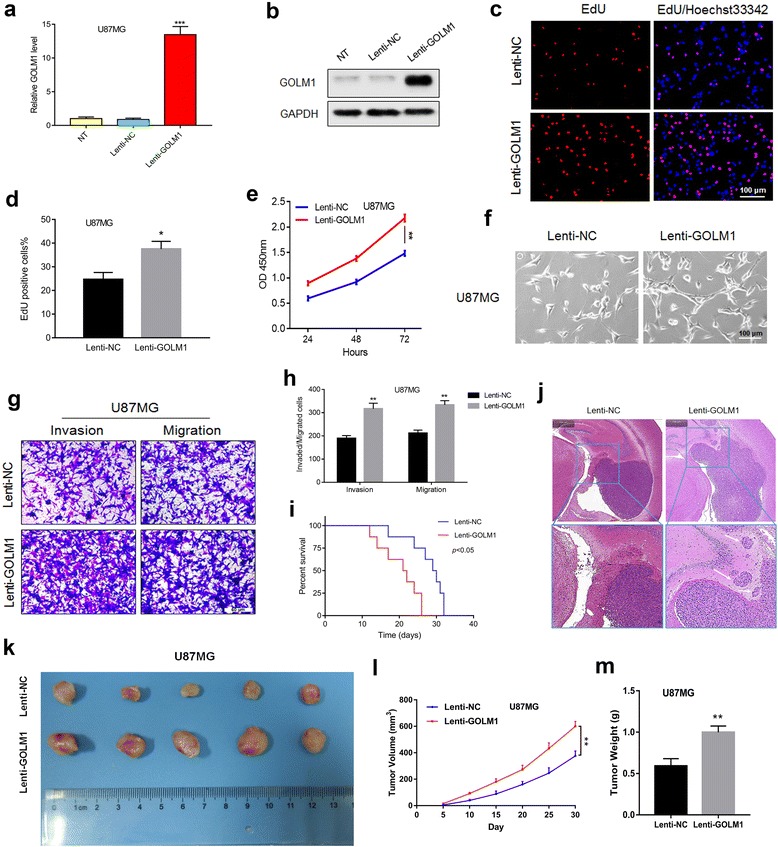
GOLM1 overexpression promotes U87MG cells’ invasion and proliferation in vitro and in vivo. Overexpression of GOLM1 in U87MG cells was confirmed by a qRT-PCR and b western blot analysis. c EdU assays for U87MG-Lenti-NC and -Lenti-GOLM1 cells. Scale bar = 100 μm. d Graphic representation of ratios of EdU positive U87MG- Lenti-NC and -Lenti-GOLM1 cells. Data are presented as the mean ± SEM. e Cell viability of U87MG-Lenti-NC or -Lenti-GOLM1 cells evaluated in the CCK8 assay. f Representative images of the morphology of U87MG- Lenti-NC and -Lenti-GOLM1 cells under bright field microscopy. Scale bar = 100 μm. g Representative images of Transwell assays performed with U87MG-Lenti-NC and -Lenti-GOLM1 cells after incubation for 24 h. Cells were fixed and stained with crystal violet. Scale bar = 50 μm. h Quantification of invaded and migrated cells in Transwell assays. Data are presented as the mean ± SEM. Scale bar = 50 μm. i Kaplan-Meier survival analysis of mice implanted with U87MG-Lenti-NC (n = 8) and -Lenti-GOLM1 (n = 8) cells. The log-rank test was used to calculate P-values, which were <0.05. j Representative H&E images of intracranial tumors derived from U87MG-Lenti-NC and -Lenti-GOLM1 cells. White arrows in the zoomed image highlight tumor cells that have invaded adjacent brain tissues. k Representative images of subcutaneous U87MG-Lenti-NC and -Lenti-GOLM1 xenografts after surgical removal are also shown. l Tumor growth curves in nude mice from the U87MG-Lenti-NC and -Lenti-GOLM1 groups. m Tumor weight from the U87MG-Lenti-NC and -Lenti-GOLM1 groups. Data are presented as the mean ± SEM. (*P < 0.05, **P < 0.01)