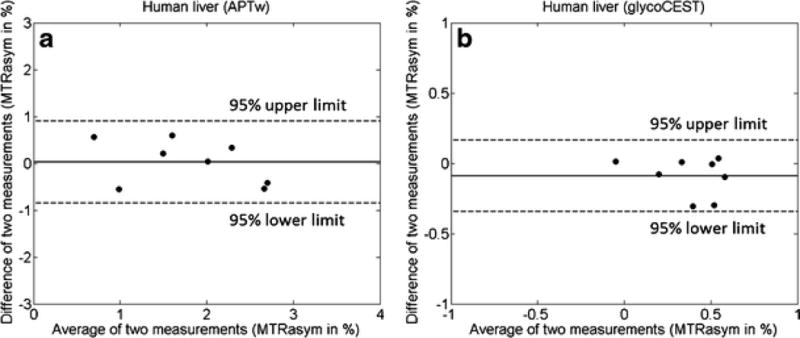
Fig. 6.

Bland-Altman plots for the liver APTw (A) and the liver GlycoCEST (B) of 8 healthy volunteers. The inter-scan differences of MTRasym values are plotted against the average MTRasym values of two scans for each subject.

Bland-Altman plots for the liver APTw (A) and the liver GlycoCEST (B) of 8 healthy volunteers. The inter-scan differences of MTRasym values are plotted against the average MTRasym values of two scans for each subject.