
Figure 3. Twist increases the medial wall thickness to lumen diameter ratio.
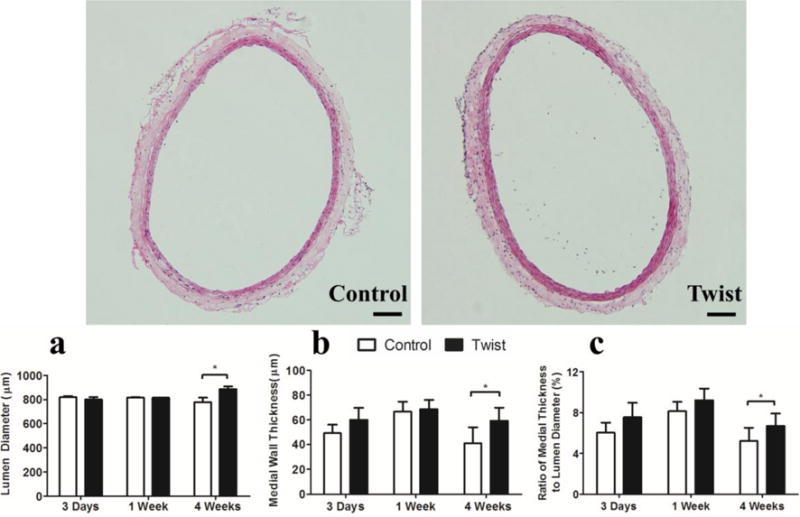
Photographs: Representative cross-sectional images of control and twisted arteries. H&E stain, Scale bar represent 100 μm. Bargraphs: Comparisons of arterial lumen diameter (a), medial wall thickness (b) and medial wall thickness to lumen diameter ratio (c) of control and twisted arteries. Values are mean ± SD, n = 6, * p < 0.05 twisted vs. controls.