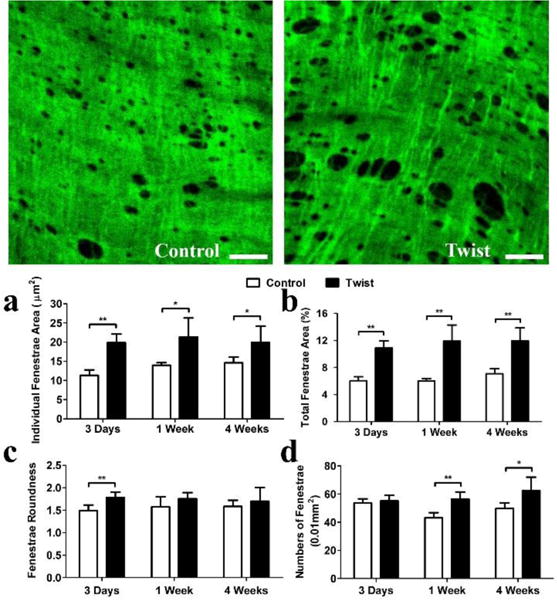
Figure 5. IEL fenestrae shape and area changes over time.

Photographs: Representative en face confocal images of IEL fenestrae of arteries from control and twist group at 1 week. Scale bar represent 20μm. Bargraphs: Comparison of a) mean fenestrae area; b) total fenestrae area; c) fenestrae roundness, and d) fenestrae numbers, between the control and twisted arteries at 3 time points. * p < 0.05 vs. controls, ** p < 0.01 vs. controls. n = 5.
