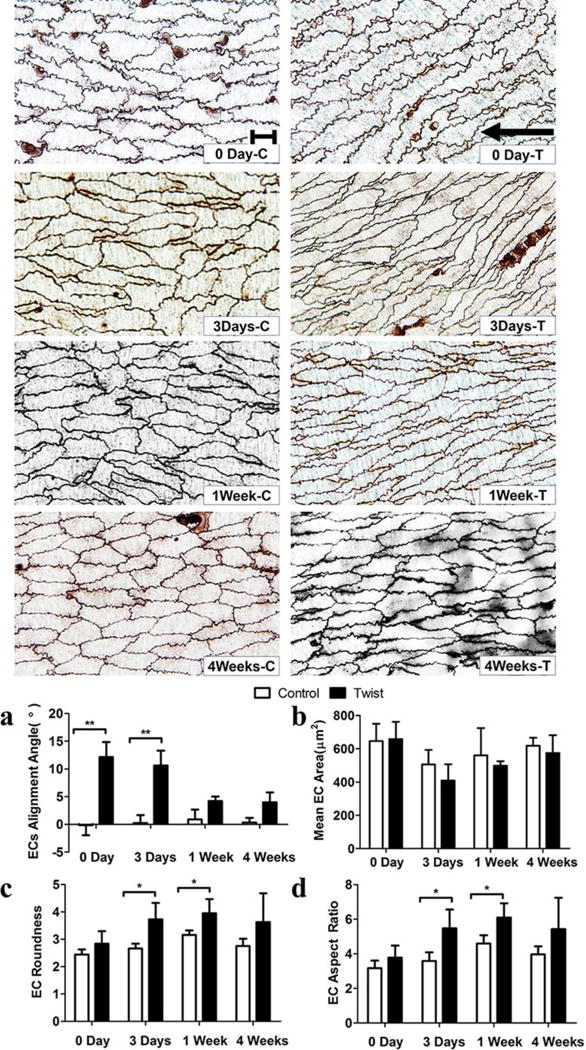
Figure 7. Twist induces EC shape and orientation changes.

Top: Micrographs from en face light microscopy illustrating the contours of endothelial cell visualized by silver staining. Scale bar represent 20 μm. “C” and “T” in the labels represent control and twisted arteries. Arrow indicates the flow direction. Bargraphs: Comparisons of (a) EC alignment angle, (b) EC area (size), (c) EC roundness, and (d) EC aspect ratio in the control and twisting groups. Values are mean ± SD, n = 5, * p < 0.05 vs. controls, ** p < 0.01 vs. controls.
