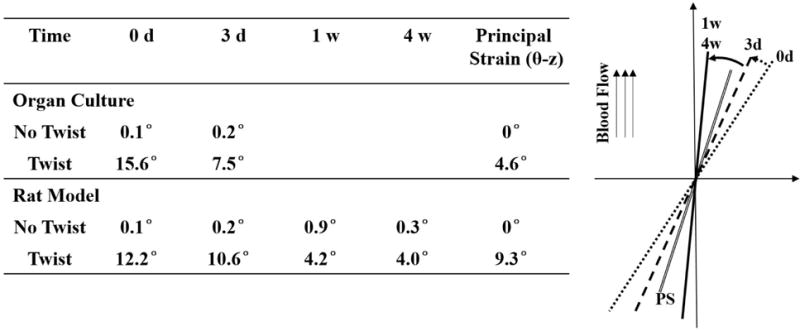
Figure 8. Comparison of EC orientation and principal strain direction.

Table: comparison of the actual alignment angle values at different time points and with data from previous organ culture study (Wang et al., 2015). Figure: Illustration of EC orientation in twisted arteries at 0 day (dotted line), 3d, (dash line), 1wk & 4wks (solid line) compared to the direction of the principal strain (PS, double solid line). Angles were proportionally enlarged for better visualization.
