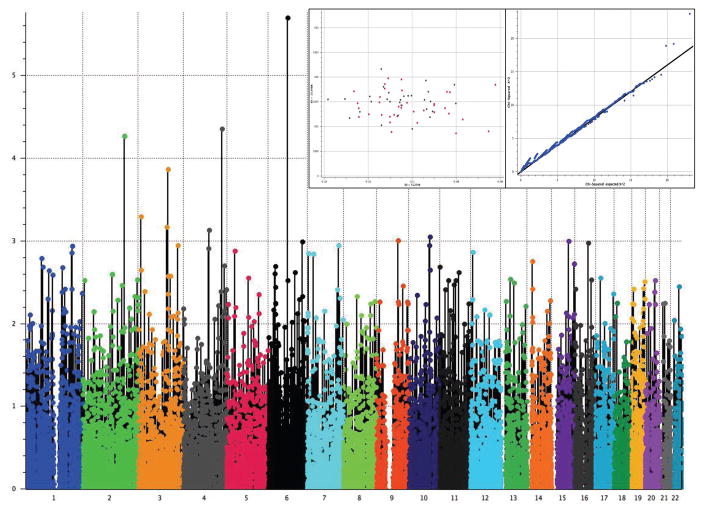
Fig 2. Manhattan Plot to Evaluate Pharmacogenetic Response As Remitters (n=36) and Non-responders (n=29).
Genotype model (additive) after correcting stratification by principal component analysis (PCA) was used. A unique significant peak at chromosome 6 was found significant after correction for multiple comparisons by FDR. In the inset, the principal component analysis shows absence of stratification between remitters and non-responders (right box), and a Q-Q plot depicts the fitting of χ2 against the χ2 expected distribution (left box).

