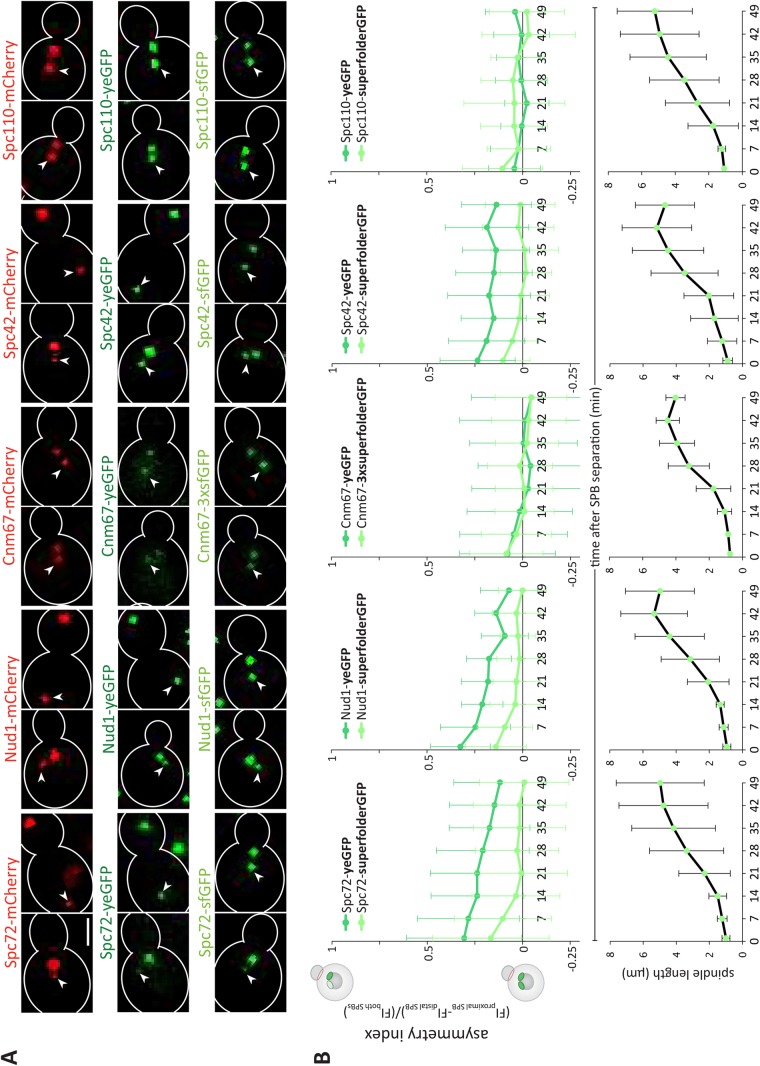
FIGURE 2:
Analysis of outer plaque maturation kinetics. (A) Representative images and quantification of asymmetry index (dividing the difference between the fluorescence intensity of the proximal and distal SPB by the total fluorescence intensity of both SPBs) over time after SPB separation of Spc72, Spc42, Cnm67, and Spc110 tagged with sfGFP or yeGFP and quantification of corresponding spindle length (μm) (n = 120 cells analyzed at each time point from three independent experiments, mean ± SD). Scale bars, 2 μm. The distal SPB is pointed out with a white arrow.

