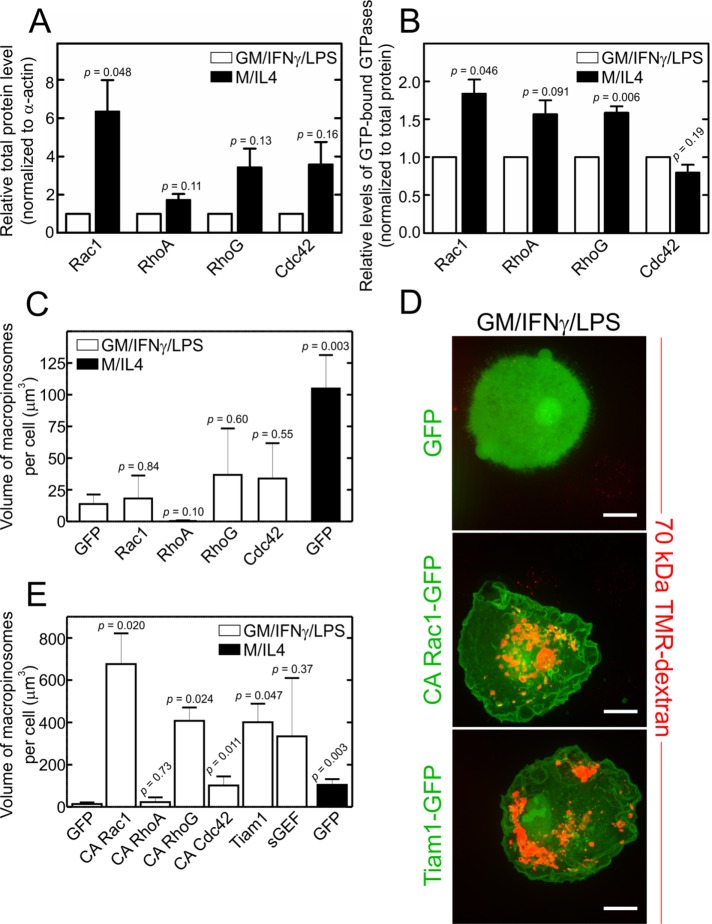
FIGURE 4:
Abundance, overexpression, and activation of Rho GTPases in GM/IFN-γ/LPS– and M/IL4-cultured macrophages. (A) GM/IFN-γ/LPS– and M/IL4-cultured macrophages were lysed, separated by 10% SDS–PAGE, and subjected to immunoblotting with anti-Rac1, anti-RhoA, anti-RhoG, or anti-Cdc42 antibodies. Intensities of the bands were normalized to β-actin, and then plotted as a ratio relative to GM/IFN-γ/LPS–cultured macrophages in each experiment for each GTPase. Data are means ± SEM of three to four independent experiments. Typical immunoblots are shown in Supplemental Figure S3A. (B) GM/IFN-γ/LPS– and M/IL4-cultured macrophages were lysed, followed immediately by measurement of the GTP-bound form of Rac1, RhoA, and Cdc42 using the respective colorimetric G-LISA kit. The measured absorbance at 490 nm was normalized to total protein levels and plotted as a ratio relative to GM/IFN-γ/LPS–cultured macrophages in each experiment for each GTPase. Data are means ± SEM of three to four independent experiments. Levels of GTP-bound RhoG in lysed GM/IFN-γ/LPS– and M/IL4-cultured macrophages were measured using a pull-down assay with a recombinant ELMO-GST loaded onto glutathione-sepharose beads, followed by 10% SDS–PAGE and immunoblotting with an anti-RhoG antibody. Levels of RhoG.GTP were normalized relative to the level in GM/IFN-γ/LPS–cultured macrophages in each experiment. A typical immunoblot for the RhoG.GTP pull-down assay is shown in Supplemental Figure S3B. Data are means ± SEM from four independent experiments. C. difficile toxin B treatment (3 h in serum-free medium) was used to inhibit all four GTPases, i.e., as a negative control, in all G-LISA and RhoG.GTP pull-down assays. (C–E) GM/IFN-γ/LPS–cultured macrophages were transfected with fluorescently tagged constructs of either wild-type (C) or constitutively active Rac1, RhoA, RhoG, or Cdc42 (D, E), or of the Rac1 and RhoG GEFs Tiam1 and sGEF, as indicated (D, E). The specific constructs used were Rac1-GFP, RhoA-GFP, RhoG-CFP, Cdc42-GFP, Rac1-Q61L-GFP, RhoA-Q63L-GFP, RhoG-G12V-CFP, Cdc42-G12V-YFP, Tiam1-GFP, and sGEF-GFP. GM/IFN-γ/LPS–cultured macrophages transfected with GFP alone were used as a negative control, while M/IL4-cultured macrophages transfected with GFP alone were used as a positive control. After 24-h transfection, the cells were incubated with fluorescently labeled 70 kDa dextran (TMR-dextran, 125 µg/ml) for 15 min at 37°C, and washed, fixed, and imaged immediately (D); only transfected cells were selected for measurements of macropinocytosis, which was quantified (C, E) as the total volume of TMR-positive vacuoles per cell from 3D stacks using 3D particle analysis in ImageJ software, applying a lower particle volume threshold of 0.26 µm3. Typical images (D) and quantifications (C, E; means ± SEM) are representative of 20–50 cells from three to five independent experiments using blood from at least two separate donors. Scale bars, 15 µm.

