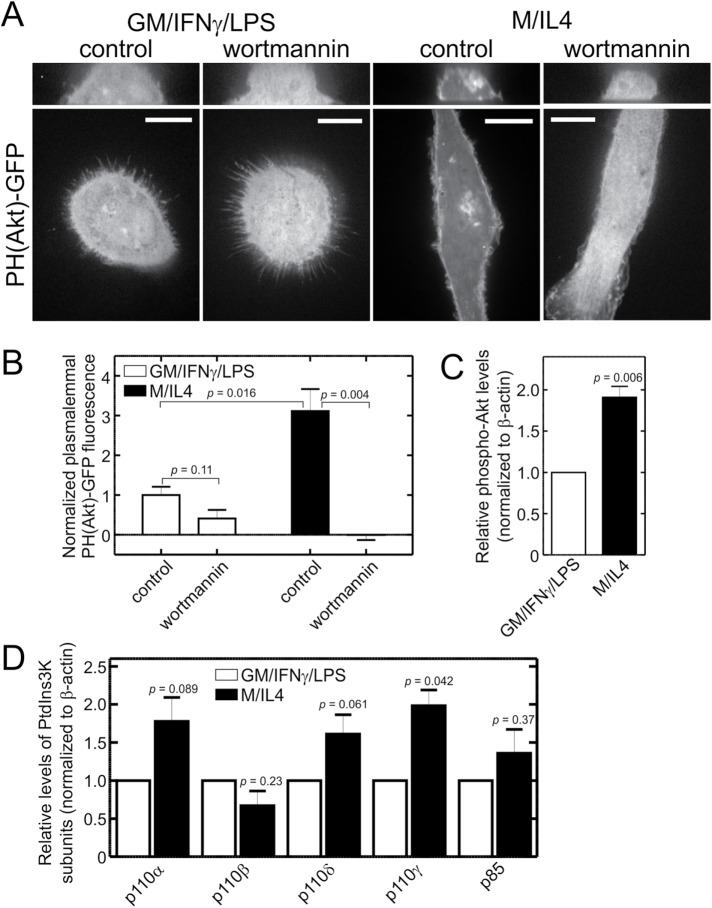
FIGURE 5:
PtdIns3K is less active and less abundant in GM/IFN-γ/LPS–cultured macrophages. (A) GM/IFN-γ/LPS– and M/IL4-cultured macrophages were transfected with PH(Akt)-GFP, a biosensor of PtdIns(3,4,5)P3, and imaged live 24 h later, before and after treatment with wortmannin (100 nM, 15 min). Scale bars, 15 µm. (B) Localization of PH(Akt)-GFP to the plasma membrane was quantified as a fractional difference in the mean gray intensity value per pixel of an area selected around the edge of the cell in the middle section of a 3D stack (MeanPM) and the mean gray intensity value per pixel of an area in cytoplasm (Meancytoplasm), i.e., (MeanPM–- Meancytoplasm)/Meancytoplasm, and normalized to the average value for GM/IFN-γ/LPS–cultured control taken as 1. Data are means ± SEM of 20–40 cells from three to four independent experiments. (C) GM/IFN-γ/LPS– and M/IL4-cultured macrophages were lysed, separated by 10% SDS–PAGE and subjected to immunoblotting with an anti-phospho-Akt antibody. Intensities of the bands were normalized to β-actin, and then plotted as a ratio relative to GM/IFN-γ/LPS–cultured macrophages in each experiment; means ± SEM of four independent experiments are plotted. A representative immunoblot is shown in Supplemental Figure S4A. (D) GM/IFN-γ/LPS– and M/IL4-cultured macrophages were lysed, separated by 10% SDS–PAGE and subjected to immunoblotting with anti-p110α, anti-p110β, anti-p110δ, anti-p110γ, or anti-p85 antibody. Intensities of the bands were normalized to β-actin, and then plotted relative to GM/IFN-γ/LPS–cultured macrophages in each experiment. Data are means ± SEM of three to six independent experiments. Typical immunoblots are shown in Supplemental Figure S4B.

