Figure 5.
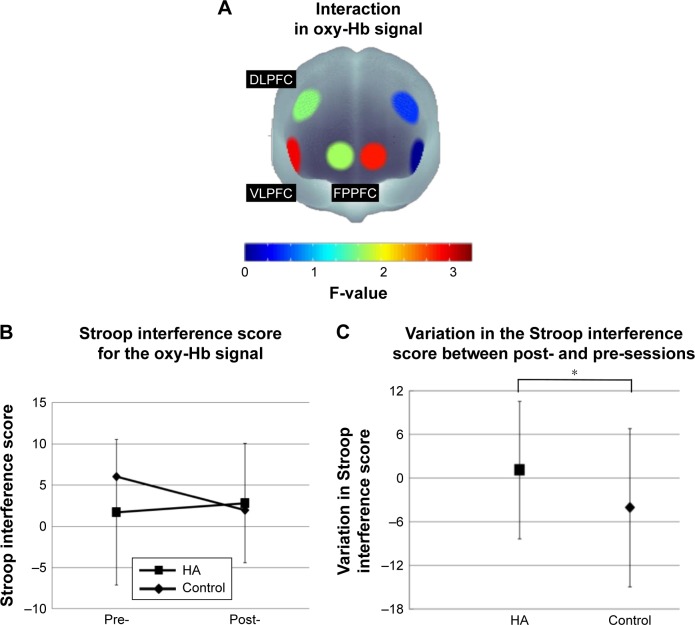
Changes of the Stroop interference score for the oxy-Hb signals.
Notes: (A) F-map of oxy-Hb signal change showing the interaction between experiment (HA/control) and session (pre/post) in six ROIs. (B) The Stroop interference score for R-VLPFC oxy-Hb signal. We subtracted the cortical hemodynamic change during the congruent condition from that during the incongruent condition. (C) The variation in the Stroop interference score for R-VLPFC oxy-Hb signal between post- and pre-sessions. F-map represents the F-value which obtained from statistical analysis as the color spectrum attaching brain figure. *p<0.1.
Abbreviations: oxy-Hb, oxygenated hemoglobin; HA, housework activity; ROIs, regions of interest; R-, right; VLPFC, ventrolateral prefrontal cortex; DLPFC, dorsolateral prefrontal cortex; FPPFC, frontopolar prefrontal cortex.

