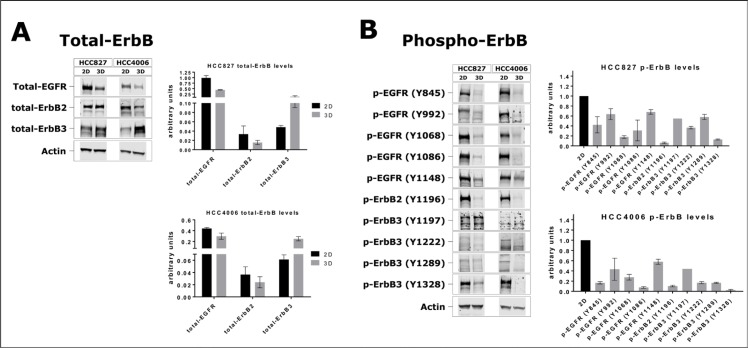
Figure 6. Expression and phosphorylation of ErbB family members in 2D and 3D cultures.
(A) Immunoblots and quantification of total EGFR, ErbB2 and ErbB3 protein levels in HCC827 and HCC4006 cells cultured as monolayers or as spheroids. Total ErbB protein levels were normalized against actin. (B) Phosphorylation of the intracellular domain of EGFR, ErbB2 and ErbB3 on different tyrosines. Phosphorylation levels were normalized against the respective total ErbB protein, which in turn was not normalized to actin. Bars represent the mean ± s.d. of at least three independent experiments (except for p-ErbB3, Y1197).

