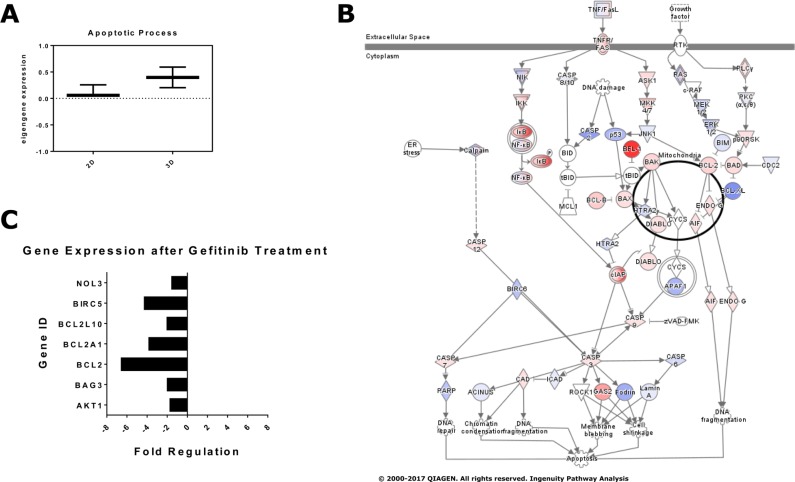
Figure 7. Expression of apoptosis- and survival-associated genes in 2D and 3D cultures.
(A) Affymetrix Gene Chip data were imported into R and processed using oligo and limma packages of R. Quality control was done using the R package arrayQualityMetrics. Eigengene calculation was carried out using the WGCNA with modules defined by gene ontology term Apoptosis - GO:0006915. A gene was considered to be part of the module if it was annotated directly with the respective GO-Term. Note that the expression of genes involved in apoptosis was substantially altered in the 3D spheroid cultures. (B) Pathway analysis of apoptosis-associated genes using the Apoptosis Pathway of QIAGEN's Ingenuity Pathway Analysis©. (C) 2D and 3D cultures were treated for 24 hours with 5 nM gefitinib. RNA was isolated und processed for RT-qPCR using the Human Apoptosis RT2 Profiler PCR Array. The transcription of several genes associated with cell survival was downregulated in the 3D cultures upon gefitinib treatment. Each data point represents the mean of two independent experiments.

