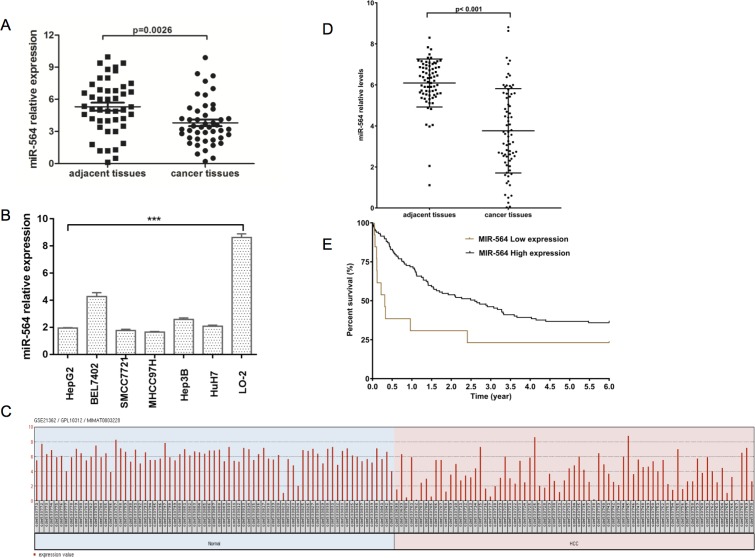
Figure 1. miR-564 expression is downregulated in HCC.
(A) miR-564 expression in HCC tissues and adjacent noncancerous tissues was quantified by qRT-PCR. The differences were statistically significant. (B) The expression of miR-564 in different HCC cell lines and the normal liver cell line LO-2 was measured by qRT-PCR; U6 was used as an internal reference. (C) miR-564 data were collected from the GEO dataset GSE21362. After quality control, 73 HCC and adjacent noncancerous liver samples were used for the analysis. (D) Differentially expressed levels of miR-564 in the GSE14520 dataset were determined using the Limma package on the R platform. The cutoff values for significantly differentially expressed miR-564 were a P value < 0.01 (Student's t-test) and |lgFC| > 1 (fold change). (E) HCC patient survival was analyzed using data downloaded from TCGA database. A total of 130 HCC patients were included in the survival analysis. These patients were divided into two groups, the miR-564-low and miR-564-high groups, based on their miR-564 expression levels. miRNA and gene expression levels were measured using the Limma package on the R platform. The cutoff threshold was set to separate the top 10% of the miR-564-low patients from the top 90% of the miR-564-high patients. Survival curves were estimated using the Kaplan–Meier method and compared using the log-rank test. Data in the bar graphs represent the mean ± SD of three repeated experiments.

