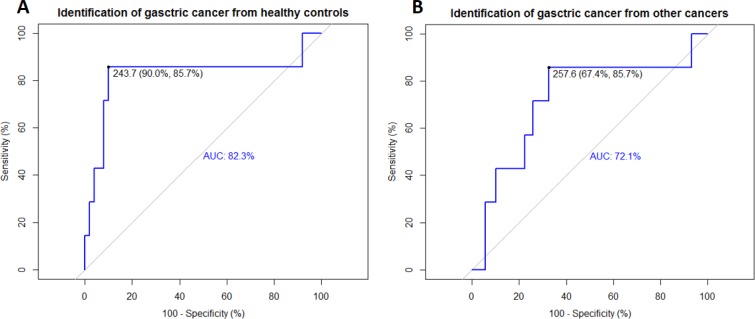
Figure 2. ROC curves revealed the diagnostic ability of DcR3 for gastric cancer.
Identifications of gastric cancer from healthy controls and other cancers by DcR3 were evaluated using ROC curves. (A) Identification of gastric cancer from healthy controls using the ROC curve; sensitivity = 85.7%, specificity = 90.0%, AUC = 82.3%, threshold = 243.7 pg/mL; (B) Identification of gastric cancer from other cancers using the ROC curve; sensitivity = 85.7%, specificity = 67.4%, AUC = 72.1%, threshold = 257.6 pg/mL.

