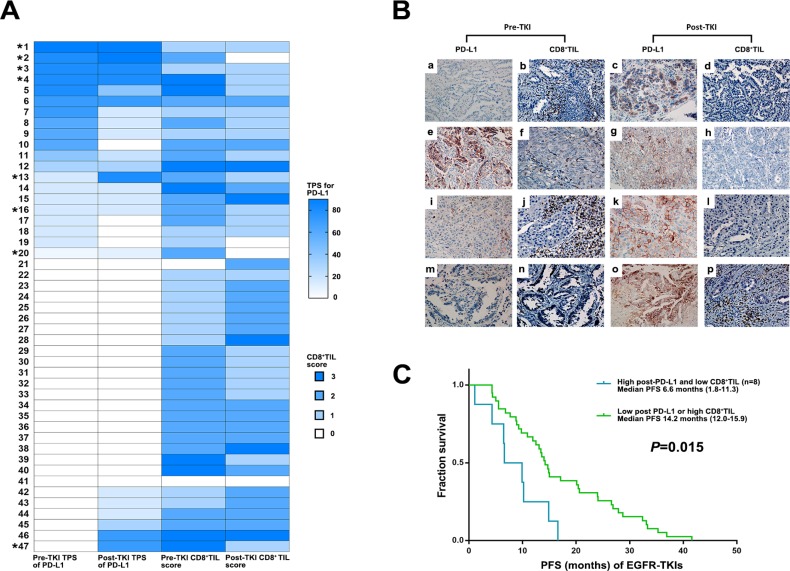
Figure 4. Clinical outcome of EGFR TKIs according to dynamic changes in PD-L1 expression and CD8+ TILs score.
(A) Change of TPS for PD-L1 and CD8+ TILs in EGFR mutant NSCLC before EGFR-TKIs and after developing acquired resistance to EGFR-TKIs among the patient with available paired biopsies (*8 patients with high post-TKI TPS for PD-L1 and low CD8+ TIL). (B) PD-L1 expression and CD8+ TILs before and after EGFR- TKIs in paired biopsies with represesntive immunohitochemical images. Pre-TKI with (a) no PD-L1 expression and (b) high CD8+ TIL showed post-TKI with (c) high PD-L1 (70%) and (d) low CD8+ TIL (No. 47 in Figure 4A). Pre-TKI with (e) high PD-L1 expression (80%) and (f) high CD8+ TIL showed post-TKI with (g) high PD-L1 expression (90%) and (h) low CD8+ TIL (No. 2 in Figure 4A). Pre-TKI with (i) low PD-L1 expression (10%) and (j) high CD8+ TIL showed post-TKI with (k) high PD-L1 (80%) and (l) low CD8+ TIL (No. 13 in Figure 4A). Pre-TKI with (m) no PD-L1 expression and (n) low CD8+ TIL showed post-TKI with (o) high PD-L1 (70%) and (p) high CD8+ TIL (No. 43 in Figure 4A). (C) Kaplan–Meier curves for PFS of EGFR-TKIs according to post-EGFRT-TKI PD-L1 TPS and CD8+ TILs (Log-rank test).

