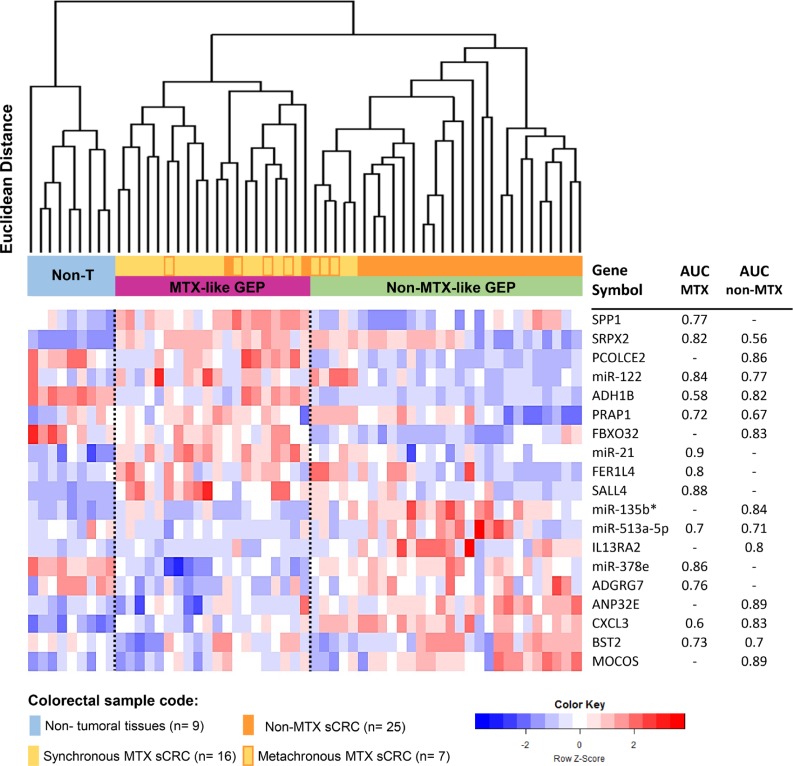
Figure 2. Association between sCRC tumor specific gene expression profiles (GEP) and the metastatic behavior of the tumor.
Unsupervised hierarchical clustering analysis and the corresponding GEP heatmap show a clear different profile between the two groups of sCRC tumors vs. non-tumoral colorectal tissues (n = 9; color coded as light blue) based on the combination of 19 selected coding (mRNA) and non-coding (small nuclear and microRNA) genes: a non-metastatic-like GEP group of tumors (non-MTX-like GEP, n = 27; colored green) which predominantly included non-metastatic sCRC cases (colored orange) and a few metachronous metastatic sCRC primary tumors (colored yellow with orange frames) vs. a metastatic-like GEP group (MTX-like GEP, n = 21; colored purple) mostly consisting of metastatic primary sCRC cases (colored yellow). Area under the curve (AUC) values derived from ROC curve analysis for those individual 19 genes selected by the prediction algorithms, which better contributed to discriminate between MTX and non-MTX tumoral groups vs. non-tumoral colorectal tissues (n = 23 vs. n = 25 vs. n = 9, respectively), are displayed in the columns in the right.

