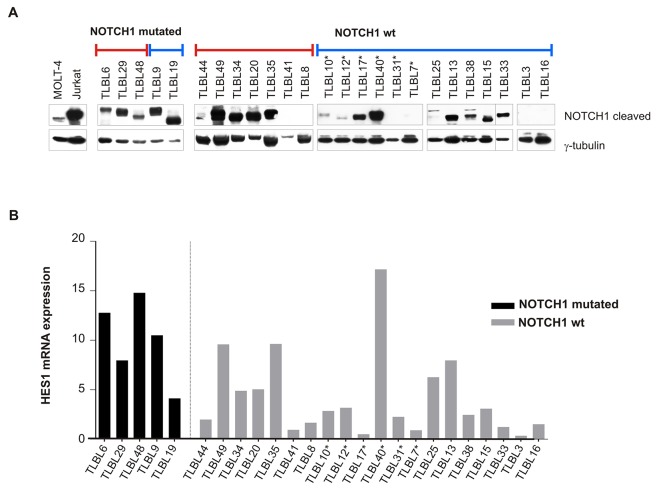
Figure 2. NOTCH1 pathway activation in T-LBL primary tumors.
(A) Western blotting analysis of intracellular cleaved NOTCH1 in T-LBL tumour biopsies. Blue line: patients with miR-223 high expression level; red line: patients with miR-223 low expression level. Lysates from cell lines MOLT-4 and Jurkat were included as positive controls. γ-tubulin was used as loading control. Vertical lines have been inserted to indicate repositioned gel lanes. (B) Expression levels of HES1 mRNA in primary tumors measured by qRT-PCR. Data have been calculated according to the comparative delta Ct method (2-ΔΔCt), using ABL gene as endogenous control. Relapsed patients are indicated with *.

