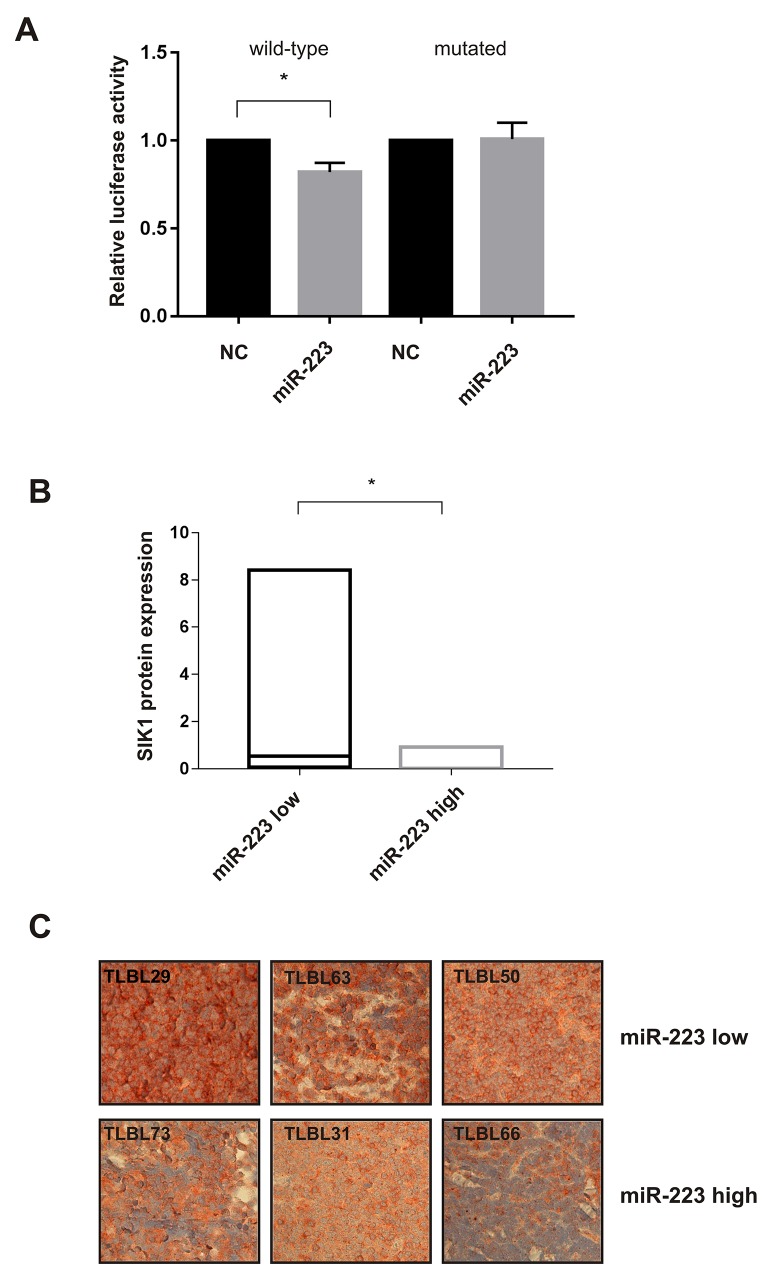
Figure 5. miR-223 modulates the expression of SIK1.
SUPT-1 cells transfected with miR-223 precursor analyzed 24 h post-transfection were used to perform Luciferase assay in cells transfected with reporter containing wild-type or mutant (mutated) binding sites in SIK1 3’-UTRs. Results from three independent experiments are shown as mean ± SEM of Firefly luciferase activity relative to controls (NC), normalized on Renilla luciferase activity. *P<0.05, (A). Boxplot represents the analysis of SIK1 protein expression in T-LBL tumour biopsies detected by immunoblotting. Density expression level was normalized on tubulin. The horizontal line in the box indicates the median expression level of SIK1 in the two miR-223 subgroups (miR-223-low and -high) of T-LBL cases. *P<0.05 (B). SIK1 staining in T-LBL specimens, belong to miR-223-low (T-LBL_29,63,50) and -high groups (T-LBL_73,66,31) (× 40) (C).

