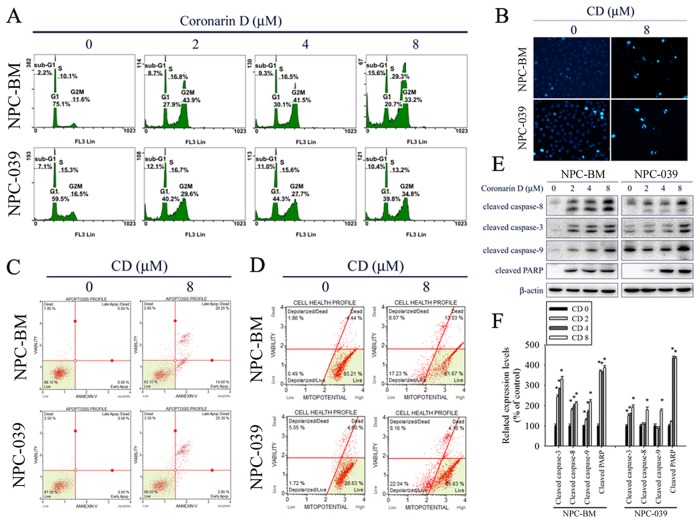
Figure 2. CD induces G2/M phase cell cycle arrest and apoptosis in NPC-BM and NPC-039 cells.
Cells were treated with indicated concentration of CD (0-8 μM) for 24 h. (A) PI staining and flow cytometry were performed to estimate cell cycle phase distribution (Sub-G1, G0/G1, S and G2/M). (B) Cells were fixed and stained with DAPI solution. Nuclear fragmentation and condensation were observed under a fluorescence microscope. (C) After treatment, cells were dual-stained with Annexin V-FITC/PI and analyzed by flow cytometry. (D) Effect of CD on mitochondrial membrane potential was done with Muse MitoPotential kit staining followed by flow cytometry. (E) A representative Western blot for expression of cleaved caspase-8, -3, -9 and PARP cleavage in cells were treated with increasing concentrations of CD. (F) Bar graphs represent the relative density of each band normalized to β-actin. Results are shown as mean ±SEM. *P<0.05, compared with the control (0 μM).

