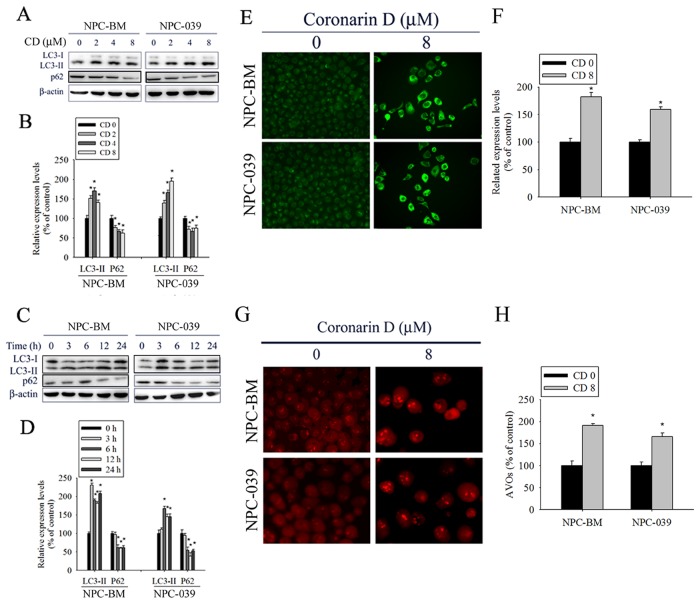
Figure 3. CD induces autophagy in NPC-BM and NPC-039 cells.
(A) Cells were treated with increasing concentration of CD (0-8 μM) for 24 h and the expression levels of LC3-I/LC3-II and p62 were examined by Western blot. (B) Bar graphs represent the relative density of each band normalized to β-actin. (C) Cells were incubated with CD (8 μM) for the indicated time intervals and the expression levels of LC3-I/LC3-II and p62 were examined by Western blot. (D) Bar graphs represent the relative density of each band normalized to β-actin. (E and F) Cells were treated with or without CD (8 μM) for 24 h, and then cells were stained with MDC fluorescent dye. MDC-stained cells were observed under a fluorescence microscope, which is an indicator of autophagosome formation. (G and H) Cells were treated with or without CD (8 μM) for 24 h, and then cells were stained with acridine orange (AO) for acidic vesicular organelles (AVOs) formation which was examined under a fluorescence microscope. The amount of AVOs (orange-red fluorescence) can be used as a marker of autophagosomes. Results are shown as mean ± SEM. *P<0.05, compared with the control (0 μM).

