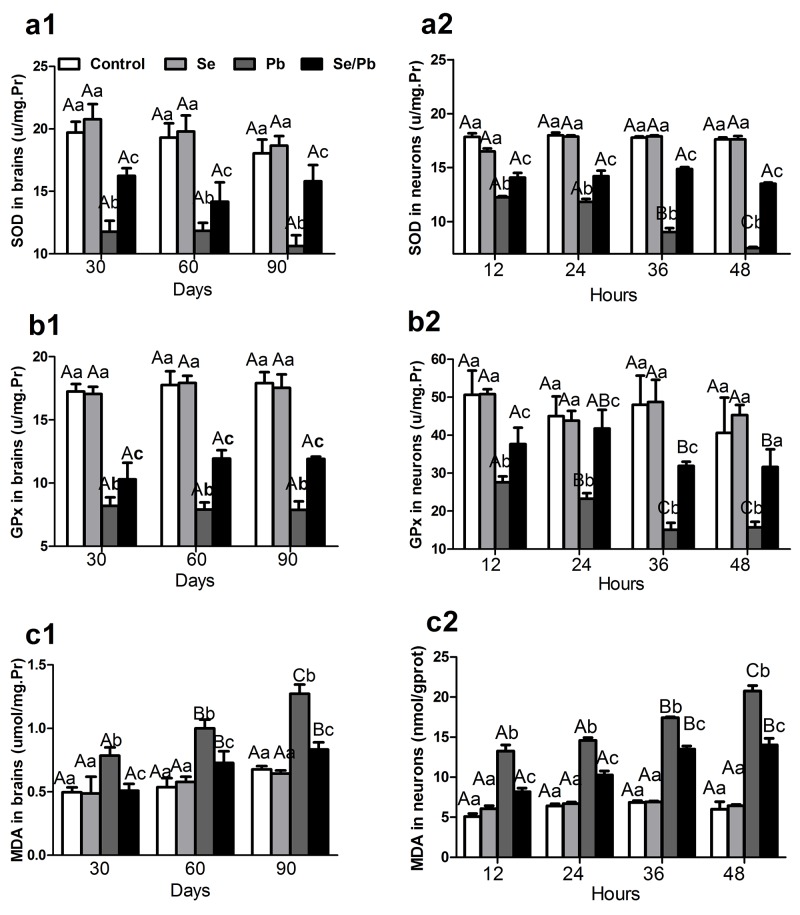
Figure 3. SOD and GPx activities, MDA content in the chicken brain tissues and embryonic neurocytes.
(a): SOD activities; (b): GPx activities; (c): MDA content (1): brain tissues; (2) embryonic neurocytes. Different lowercase letters indicate that there were significant differences (P < 0.05) among all groups at the same time point. Different uppercase letters indicate that there were significant differences (P < 0.05) among different time points in the same group.

