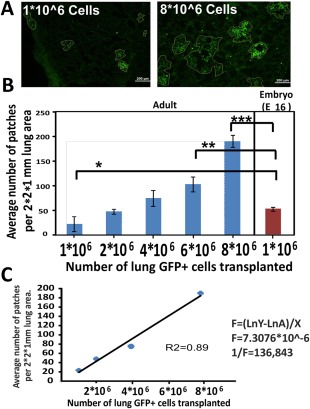
Figure 2.

Patch formation following transplantation of different lung cell doses. (A): Typical histological sections showing GFP+ patches (circled) after transplantation of 1E + 6 or 8E + 6 adult lung cells following host conditioning (scale bar = 200 µm). (B): Average number of GFP+ patches in 2 × 2 × 1 mm3 lung area of recipient mice (n = 4 mice per each group). Errors bars represent mean ± SD. t test was used in order to analyze statistical significance between the E16 group and all the others. (C): Linear regression of the average number of patches as a function of cell dose. The frequency of patch forming cells in adult lung cells was calculated from the slope of the line as indicated. Errors bars represent mean ± SD. ANOVA and Dunnett's test were used to analyze statistical significance between the E16 group and all the other groups. *, p < .05; **, p < .01; ***, p < .001. Abbreviation: ANOVA, analysis of variance.
