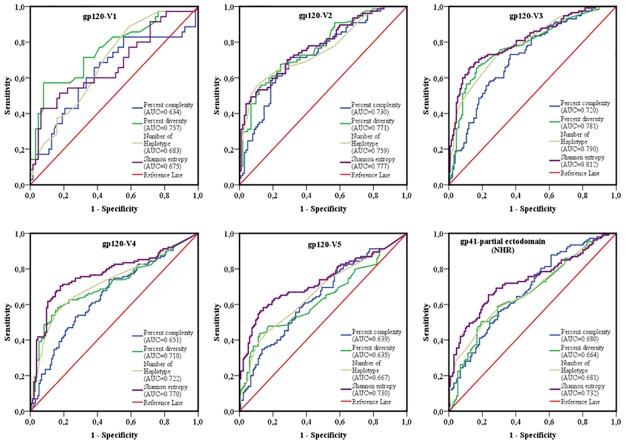
Fig 8. ROC curves comparing the performance of the 4 sequence-based diversity measures for discriminating recent from chronic HIV-1 infection.
Five HIV-1 gp120 variable loops and one part of gp41 ectodomain (NHR). Five segments represented each of the HIV-1 gp120 variable loop as well as 1 segment of the gp41- NHR ectodomain were analyzed: gp120-V1 loop, gp120-V2 loop, gp120-V3 loop, gp120-V4 loop, gp120-V5 loop and part of the gp41-NHR ectodomain. The Y axis represents the proportion of sequences from true recent HIV-1 infected individuals (sensitivity), and the X axis represents the proportion of recent HIV-1 infected individuals who were incorrectly classified (1-specificity). ROC = receiver operating characteristics. NHR = N-terminal heptad repeat. AUC values between 0.8 and 1 were considered performance measures.

