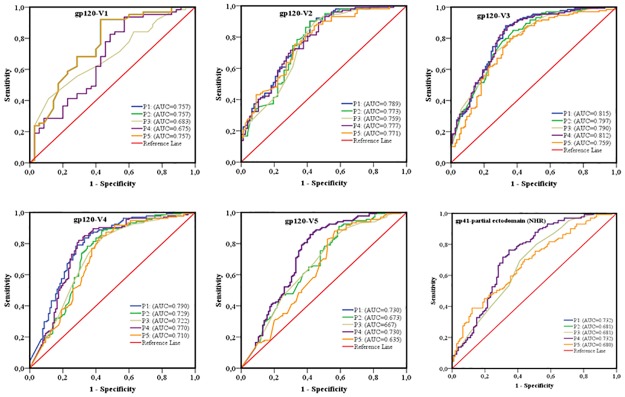
Fig 10. ROC curves comparing the predictive performance of different combinations of sequence-based diversity measures of five HIV-1 env gp120 variable loops and one part of the gp41-ectodomain (NHR) to identify HIV infection recency.
Five combinations of sequence-based diversity measures were analyzed. Shannon entropy + percent diversity + percent complexity: P1; percent diversity+ number of haplotypes+ percent complexity: P2; number of haplotypes+ percent complexity: P3; Shannon entropy+ percent complexity: P4 and percent diversity+ percent complexity: P5. Six HIV-1 env segments were considered: gp120-V1 loop; gp120-V2 loop; gp120-V3 loop; gp120-V4 loop; gp120-V5 loop and, gp41-NHR (partial ectodomain). NHR = N-terminal heptad repeat. ROC = receiver operating characteristics; AUC = area under the curve. AUC values between 0.8 and 1 were considered performance measures.

