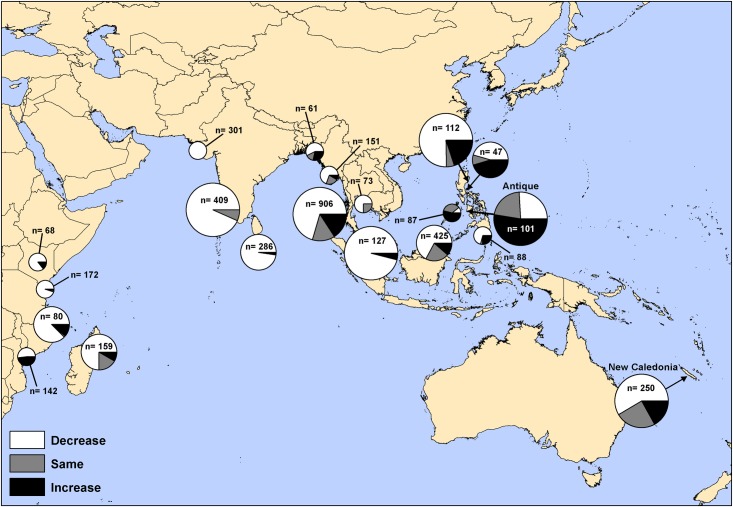
Fig 3. An example of regional-level GIS outputs derived via the questionnaire data: Collated fisher responses to trends in dugong captures in fishing gear across all recorded years, scaled by numbers of dugongs encountered at each location: small pie charts <50 dugongs reported; medium pie charts 50–100 dugongs reported; large pie charts >100 dugongs reported; dugong captures increasing (black segments), decreasing (white segments) or remaining the same (grey segments).
Note that reports of dugong sightings could include multiple reports of the same individual. Source: [30].

