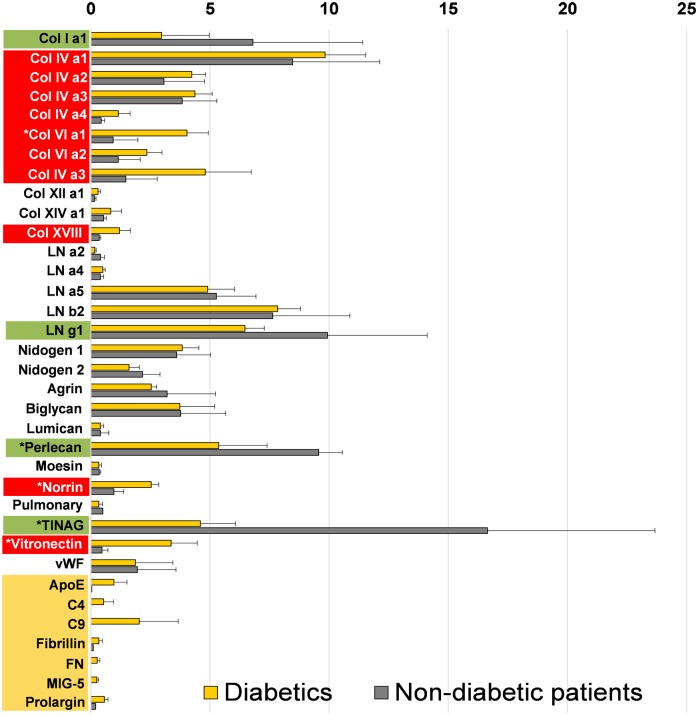
Fig 3. Graphic representation showing the relative abundance of BM proteins in vascular BMs from diabetic (yellow bars) and non-diabetic donors (grey bars) in percent, relative to the entire ECM proteome set to 100%.
The means from three diabetic and three non-diabetic BM analyses with standard deviation are shown. The proteins that are more abundant in diabetic as compared to non-diabetic BMs are labeled in red, the proteins less abundant in green. White stars mark statistically significant differences. The proteins in yellow at the bottom of the graph were considered diabetes-typical BM proteins.

