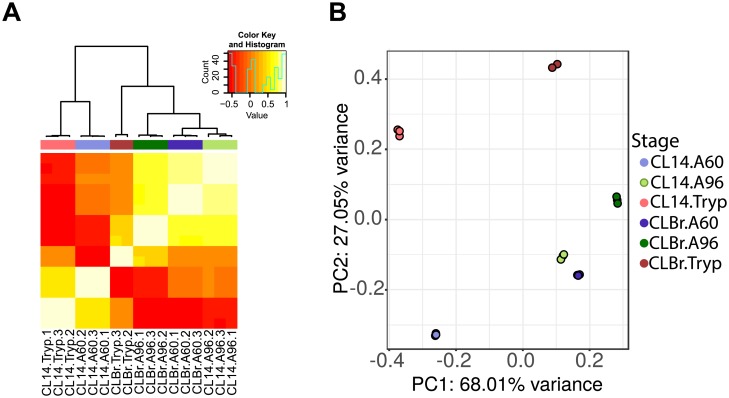
Fig 2. Global statistical assessment of biological replicates.
Heat-map (A) and Principal Component Analysis (PCA) plots (B) of RNA-Seq data generated from the libraries mapped to the T. cruzi genome following removal of rRNA/tRNA features. Once the outlier sample was removed and data passed through normalization and surrogate variable analysis, the strong clustering by condition became evident in both analyses. In both plots, each sample is color coded by developmental stage/strain (Tryp: trypomastigotes; A60: amastigotes collected 60 hpi; A96: amastigotes collected 96 hpi).

