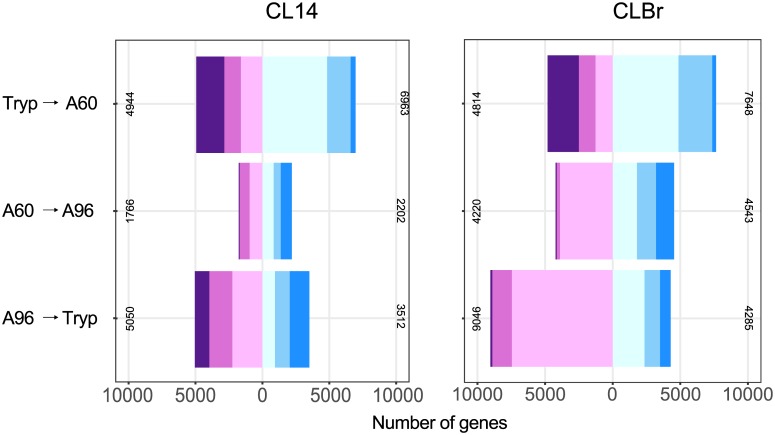
Fig 3. Differential gene expression across T. cruzi CL-14 and CL Brener developmental stages.
Bar plots of the numbers of genes deemed significantly differentially expressed (adjusted P value <0.05) in (A) CL-14 and (B) CL Brener. The numbers of genes in each category are defined as: log2 fold changes |0–1| (light cyan for positive, light plum for negative), |1–2| (light sky blue for positive, orchid for negative), and |2+| (dodger blue and purple respectively). The diverging patterns of expression are shown by changing bar patterns.

