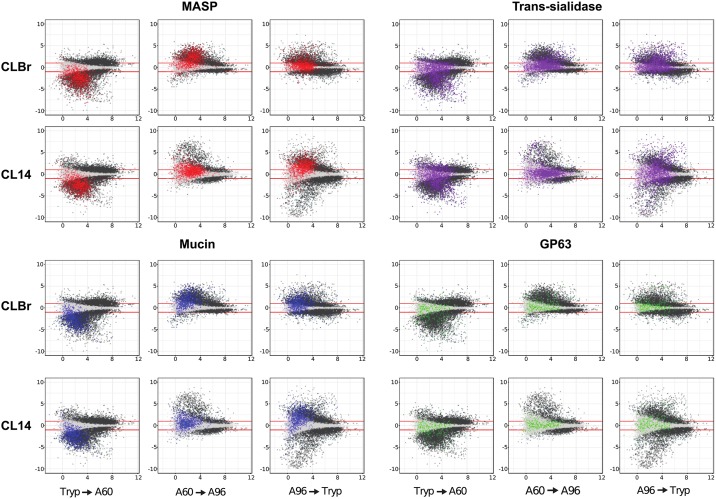
Fig 4. Comparative global transcriptional expression patterns of T. cruzi genes encoding polymorphic cell surface proteins in CL Brener and CL-14.
MA plots depicting the log2 fold change (logFC) of genes against the average expression level during the transition of CL Brener and CL-14 across developmental stages. Each dot represents one gene and colored dots represent members of the four of the six largest T. cruzi gene families analyzed: MASP (red), Mucin (blue), Trans-sialidase (purple), and GP63 (green). Dots above and below the red lines represent differentially expressed genes (logFC >1).

