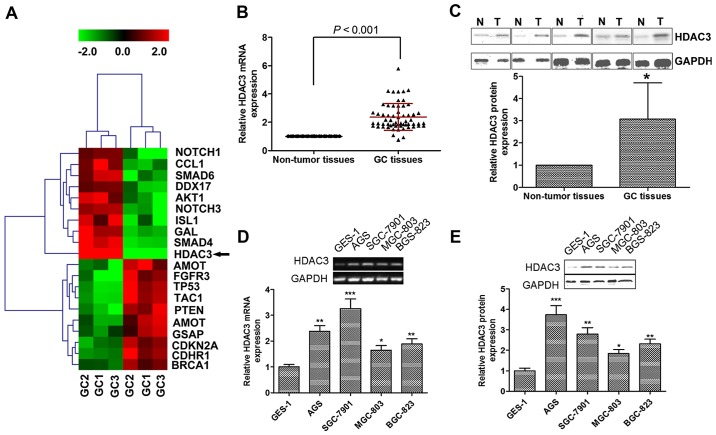
Figure 1.
Histone deacetylase 3 (HDAC3) is upregulated in gastric cancer (GC) tissues and cell lines. (A) HDAC3 was the most significantly upregulated gene as shown by microarray analysis. Green and red color intensity refers to downregulation and upregulation, respectively. (B) HDAC3 mRNA and (C) protein levels were significantly upregulated in GC tissues compared to non-tumor tissues. (D) HDAC3 mRNA and (E) protein levels were significantly upregulated in GC cell lines compared to the normal cell line. RNAs were subjected to cDNA synthesis and RT-qPCR examine the mRNA levels of HDAC3. Proteins from GC and non-tumor tissues/normal cells were subjected to western blot analysis with anti-HDAC3 and anti-GAPDH antibodies. Data are presented as the means ± SEM. *p<0.05, **p<0.01 and ***p<0.001 vs. non-tumor tissue or normal cells.

