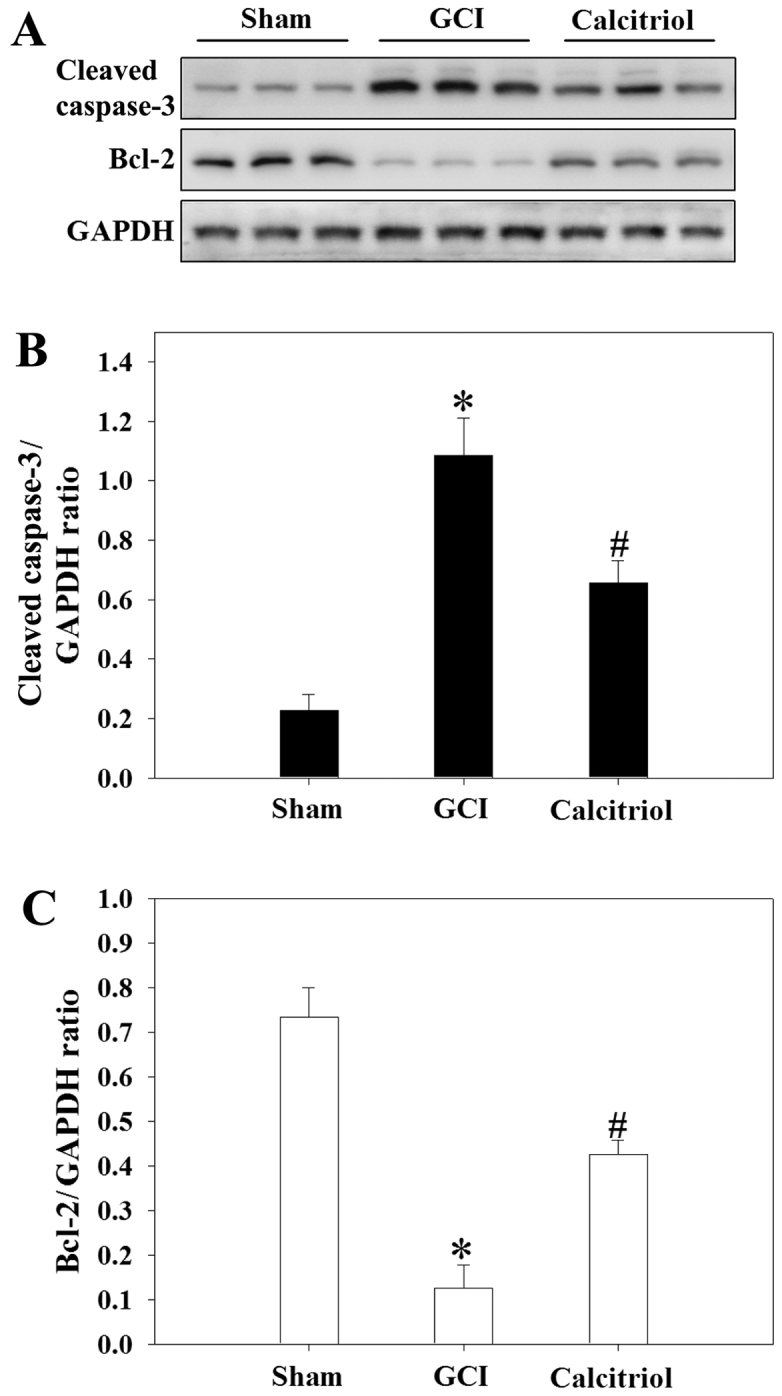
Figure 7.

Effect of calcitriol on cleaved caspase-3 and Bcl-2 expression after GCI. (A) Western blot analysis indicating the levels of cleaved caspase-3 and Bcl-2 in the cortex of rats at 3 days. (B and C) The quantitative results of cleaved caspase-3 and Bcl-2 were determined as the densitometric ratio vs. the GAPDH bands. Values are expressed as the mean ± standard error (n=5 for each group). *P<0.001 vs. Sham group; #P=0.006 vs. GCI group (cleaved caspase-3) and #P=0.002 vs. GCI group (Bcl-2). GCI, global cerebral ischemia; Bcl-2, B-cell lymphoma-2.
