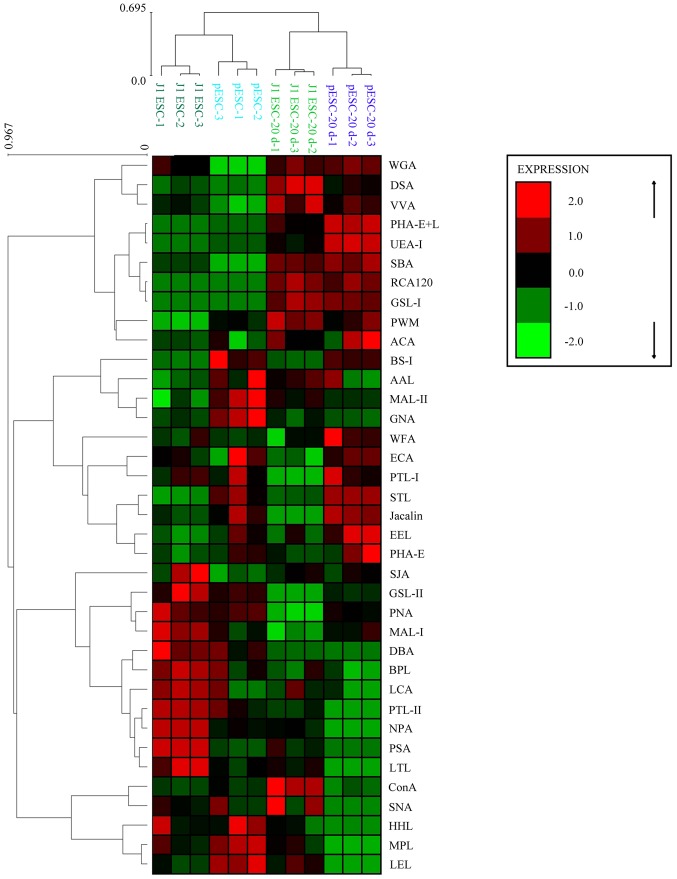
Figure 4.
Heat map and hierarchical clustering. Lectin microarray data of 37 lectins of J1 embryonic stem cells (ESCs) and parthenogenetic ESCs (pESCs) during adipogenesis (ES and EB stages, 5, 10, 15 and 20 days) were mean-normalized then analyzed by Expander 6.0 software. The color indicates expression levels relative to other data in the row. Red, high; green, low; black, medium. ES, embryonic stem; EB, embryoid body.

