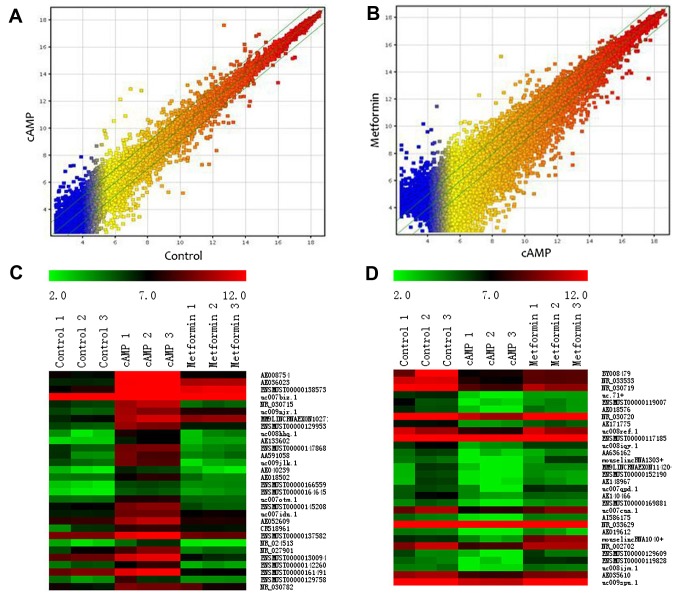
Figure 2.
Comparison of lncRNA expression profiles in primary mouse hepatocytes of the three groups. The differential expression profiles of lncRNAs were analyzed by microarray. Scatter plots are presented to show the lncRNA expression variation between (A) the cAMP group and the control group and (B) the metformin group and the cAMP group. The values on the x- and y-axes in the scatter-plot are the normalized signal values of each group (log2 scaled). The lncRNAs above the top green line and below the bottom green line in the scatter plots indicate a >2-fold-change of lncRNA expression. The heatmaps show (C) the top 30 cAMP-upregulated lncRNAs and (D) the top 30 cAMP-downregulated lncRNAs reversed by metformin. Red indicates a relatively high expression and green indicates a relatively low expression. lncRNA, long non-coding RNA; cAMP, cyclic adenosine monophosphate.

